Australian Stock Exchange Limited (ASX) – Sell
COMPANY DATA
| Date of Report | ASX | Price | Price Target | Analyst Recommendation |
| 20/08/18 | ASX | A$68.02 | A$58.18 | SELL |
| Date of Report 20/08/18 | ASX ASX |
| Price A$68.02 | Price Target A$58.18 |
| Analyst Recommendation SELL | |
| Sector: Financials | 52-Week Range: A$51.81 – 68.91 |
| Industry: Diversified Financials | Market Cap: A$13,224.5m |
Source: Bloomberg
INVESTMENT SUMMARY
We rate ASX as a Sell due to the following reasons:
- Current valuation of 24.5x PE-multiple and sustainable dividend yield of ~3.6% (with committed payout ratio of 90%) adequately reflect Company’s strong market position.
- Capex execution risks with ROIC falling short of expectations.
- Expectations of subdued volume growth and earnings outlook.
We see the following key risks to our investment thesis:
- Regulation and competition risks.
- M&A execution risks.
- Monopoly position in a number of its segments and EBIT margin of >75% and ROTE of ~30%.
- Quality management team setup which will help any new CEO. The team has a thorough understanding of operational and IT needs going forward and deep relationships with politicians and regulators.
- Strong balance sheet with net cash and AA-credit rating.
- ASX stands to benefit from growth trends in superannuation and population. We quote the CEO from the 1H17 analyst call: “A super saving system is projected to grow from close to A$2 trillion of assets to close to $6 trillion of assets in 15 years. This will create a strong ongoing demand for equity and debt assets and hedging derivatives. Many of these assets and products will be listed, traded, cleared and settled on ASX. From the demand capital side of the equation, we’re in a growing economy with a growing population which has a growing demand for capital. As such, there’s now identifiable underlying long-term growth at the core of our franchise”
- ASX stands to benefit from structural growth from global connectivity. We quote the CEO from the 1H17 analyst call: “Further to this, in both cash and Derivative business, the automation of markets, globalization, and the 24-hour nature of markets should lead to an additional structural growth in ASX Trading, Technical Services and Data Services businesses”.
Figure 1: ASX 1H18 Revenue split by segments
Source: Company
ANALYST’S NOTE
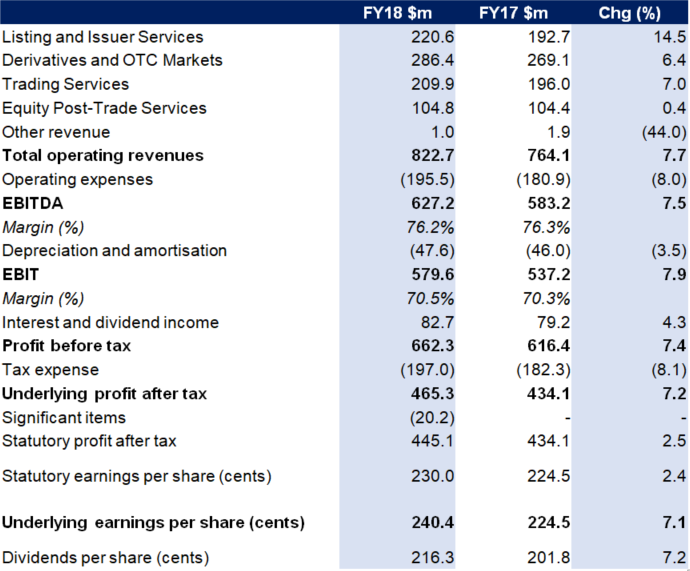
ASX reported FY18 results which showed the strongest revenue growth in 8 years, this in turn translated into statutory NPAT up +2.5% to $445.1m or underlying NPAT up +7.2% to $465.3m, and equated to underlying EPS up +7.1% to 240.4cps and final DPS up +9.3% to 109.1c (bringing the total to $2.163 cps , up +7.2% over pcp and in line with dividend policy to payout 90% of underlying earnings).
Revenue was up +7.7% to $822.7 m driven by broadly across ASX segments but offset by “subdued equity market trading, which saw limited growth in the demand for trading, clearing and settlement services”.
Expenses came in as per management guidance, up 8% due to a large portion of one-offs.
EBITDA increase 7.5%. Notably, ASX reported a cost-to-income ratio of 25%.
We downgrade our recommendation to Sell on valuation grounds only and reiterate that ASX is a quality business.
- Revenue was strong. Overall revenue increase of $58.6m was driven by a number of factors including
1. Listings revenue increased by +14.5%, driven by an increase of +46% in total capital raised to $81.7bn. Both primary and secondary raisings saw growth in FY18, which has a flow on effect to issuer services revenue. There were fewer IPOs but on average, larger in FY18.
2. The ASX derivatives and OTC markets segment saw revenue up +6.4% on an increase in the number of offshore users on the ASX platform and elevated levels or intervals of volatility that were increasing volume. OTC Clearing and ASX Collateral continue to grow at a higher basis, and Austraclear and equity options saw small gains.
3. Trading Services was up +7% over pcp despite subdued nature of equity trading in general. Cash market trading revenues was slightly lower in FY18 as total on market trading reduced 2%. Info Services and Technical Services both had solid revenue growth of 9.3% and 10.1%, respectively. Info Services benefited from the acquisition of BBSW benchmark business.
4. Equity Post-Trade Services saw a subdued year, given lower turnover in equity markets. The focus of FY18 was the DLT CHESS replacement. - Expenses came in as expected. On the analyst call, management stated “underlying categories of expenses came in as expected, with increases driven by some large one-offs, such as the ASIC levy up 117% and electricity cost up 87%”. Guiding on FY19 expenses, management expects “expenses to be up by 9%, and this reflects 3 factors. Firstly, underlying growth coming through from increases in staff costs, equipment and services. As our business grows, these expenses grow around about 4%. Secondly, an increase related to our Stronger Foundations program, which I’ll talk about, which looks to improve the operational resilience of ASX and its operational efficiency. And finally, our investment in growth-related initiatives”.
- FY18 capex in line with guidance; FY19 capex guiding to ~additional $20m. ASX made $54.1m investment in FY18, broadly in line with guidance of ~$50 m. On the analyst call, management noted “for FY19, there’s no change from what I indicated at the 9-month update. That is, the replacement of the secondary data center and the acceleration of the building in technology infrastructure means we’ll see CapEx increase around about $20m over the current year… guidance for CapEx is in the range of $70m to $75m”.
- Writedown of Yieldbroker. The ASX reduced the carrying value of its shareholding in Yieldbroker by $20.2m. According to management on the analyst call, “Yieldbroker is Australia’s preferred venue for the electronic trading of bills, notes, bonds, repos and swaps”. This investment is being written down to $46.5m, however management remain “confident [that] Yieldbroker remains well-placed as the inevitable electronification of fixed income markets continue, [despite] the speed of that change has been slower than we expected”.
FY18 results summary…
Key profit and loss numbers are presented in the table below.
Figure 1: ASX FY18 Financial Summary
Source: Company
By divisions:
- Listings and Issuance services business (27% of revenue) – best performing segment and key highlight of results. Listings and Issuance Services covers capital raisings, investment products and a range of other services the ASX provides issuers. Listings revenues was up +14.5% in a buoyant capital market and was the ASX’s strongest performing segment despite “subdued market sentiment at the start of the year and was aided in the second half most notably by the Unibail-Rodamco-Westfield listing”. Annual fees and secondary capital raising drove the bulk of the revenue growth, with an increase in the total number of companies listed, the amount of secondary capital raised, an uptick in market capitalization and changes to annual listing fees.
- Derivatives and OTC Markets (35% of revenue). This segment covers all futures and OTC Clearing, equity options and Austraclear, including ASX Collateral. Revenues of $286.4m, was up +6.4% driven by
1. solid growth in futures volume, up +9.8% over the pcp;
2. a rise in volatility between late January and April that has since abated; and
3. addition of new proprietary trading customers. On the analyst call, management highlighted “there remains a positive long-term trend in our interest rate futures business. And when combined with Austraclear and our growing OTC and collateral services, we are able to provide an integrated offering that makes it easier for our customers to better manage all aspects of their rates businesses”. Pleasingly, the ASX also saw a modest growth in their equity options business for the first time since FY15, driven by growth in index options and consistent with the broader trend towards the use of passive index products. Austraclear revenues were up +3.7%, supported by good growth in holding balances which are now just under $2 trillion. Management continues “to see long-term growth in Austraclear balances, in line with the expansion of the super sector”. - Trading Services (25% of revenue). This segment encompasses Cash Equities Trading, Information Services and Technical Services. Revenues of $209.9 m, was up +7% driven by growth in Info and Technical Services, offset by somewhat weaker performance in Cash Market Trading. After a slow start driven by lower levels of volatility in 1H, cash market trading revenue improved in 2H, ending at $45.7m for FY18, down slightly on pcp. Info Services growth was driven by BBSW and some other new products launched.
- Equity Post-Trade Services business (13% of revenue). This segment encompasses clearing and settlement of the entire Australian cash market. Revenue of $104.8 m, was up just 0.4%, with clearing down slightly (-2.6% over pcp) and settlement up slightly (up +3.5% over pcp). This result was an improvement on 1H driven mainly by stronger settlement activity in 2H.
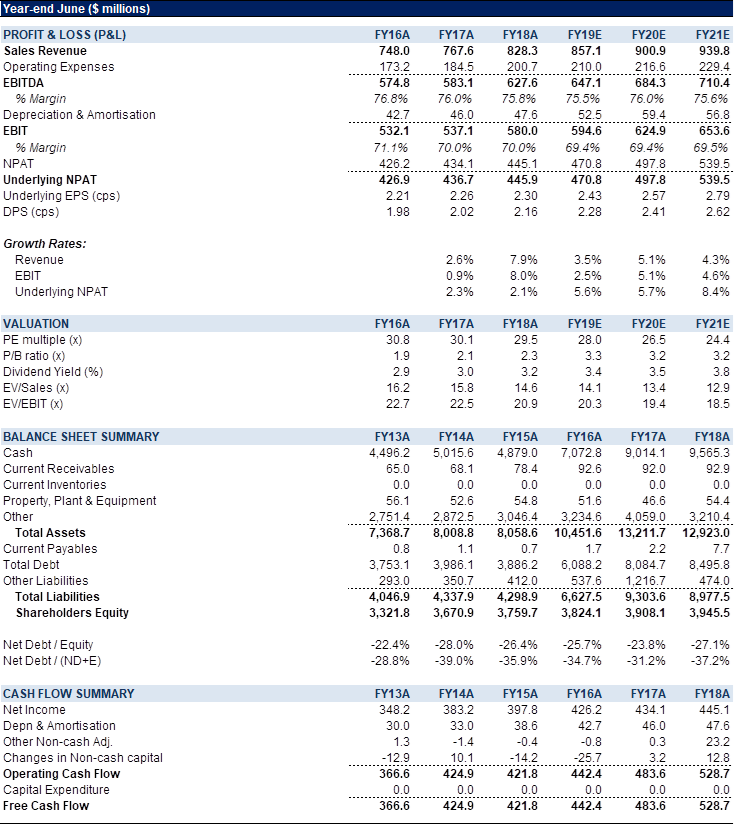
Figure 4: ASX Financial Summary
Source: BTIG, Company, Bloomberg
COMPANY DESCRIPTION
ASX Ltd (ASX) operates Australia’s main stock exchange and equity derivatives market. ASX has four core segments:
1. Listings and Issuer Services (covers capital raisings, investment products, and a range of services ASX provide to listed companies);
2. Derivatives and OTC Markets (covers OTC Clearing, equity options and Austraclear including the ASX collateral management service);
3. Trading Services (encompasses cash equities trading, information services and technical services); and
4. Equity Post-Trade Services (encompasses the clearing and settlement of the entire Australian cash market).
Recommendation Rating Guide
| Recommendation Rating Guide | Total Return Expectations on a 12-mth view |
| Speculative Buy | Greater than +30% |
| Buy | Greater than +10% |
| Neutral | Greater than 0% |
| Sell | Less than -10% |
Reach Markets Disclaimer
Reach Markets Pty Ltd (ABN 36 145 312 232) is a Corporate Authorised Representative of Reach Financial Group Pty Ltd (ABN 17 090 611 680) who holds Australian Financial Services Licence (AFSL) 333297. Please refer to our Financial Services Guide or you can request for a copy to be sent to you, by emailing [email protected].
Reach Markets Australia does, and seeks to do, business with companies that are the subject of its research reports.
Read our full disclaimer here >
