Technical Analysis – Identifying a Breakout
Traders like to use price action to predict what may happen in the short term. With hundreds of different indicators to choose from, and many different approaches to trading, how do you get an edge?
Traders like to use price action to predict what may happen in the short term. With hundreds of different indicators to choose from, and many different approaches to trading, how do you get an edge?
I’m going to run through some of the indicators that are commonly used and how we use these in one of our trading systems. I also want to highlight some of the important ingredients that will determine if you can profit from technical analysis.
What is technical analysis:
Technical analysis is the study of price history and volume data looking for patterns that could potentially indicate future movements. A stock’s price is determined by the supply and demand of its shares, meaning, if we can predict this supply and demand then we can predict the direction that the price will move.
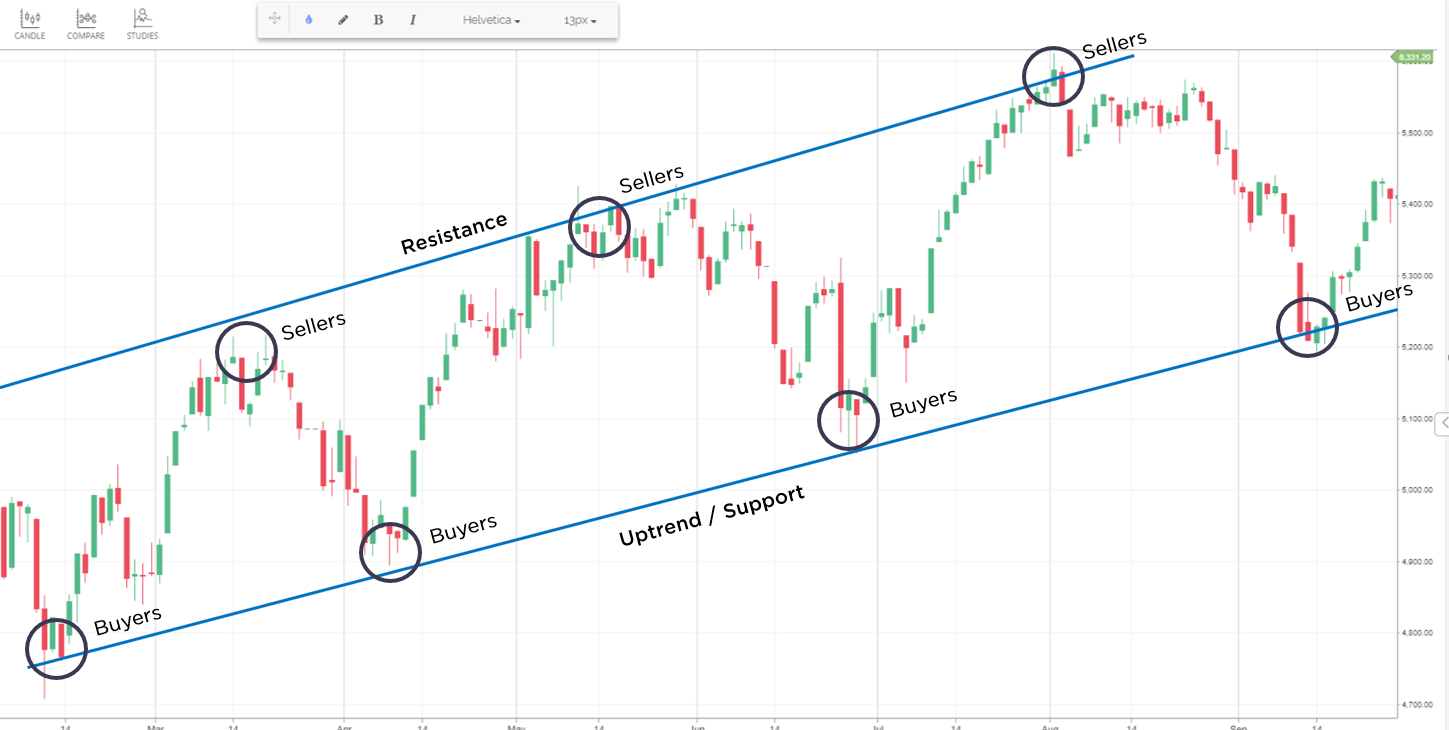
The main method of technical analysis is to use charting to look at price history, identifying key historic buying and selling points in order to predict a future selling or buying point.
Another method uses technical indicators, which are usually created using mathematical formulas, with the results represented on graphs.
Four commonly used Indicators that we use to help identify break out trades, are outlined below.
1. Candlesticks
These show the open, high, low and closing price of a stock for a specific period. The color of the candlestick will indicate if the stock traded up (green) or down (red) on that day, and can be used to help identify patterns and trading ranges alongside other indicators.

2. Key Support and Resistance Levels
Are at the top or bottom of the trading range, showing where the buyers or sellers have taken control, and are often key psychological levels. When these levels break it can be used to signal the start of a significant move.
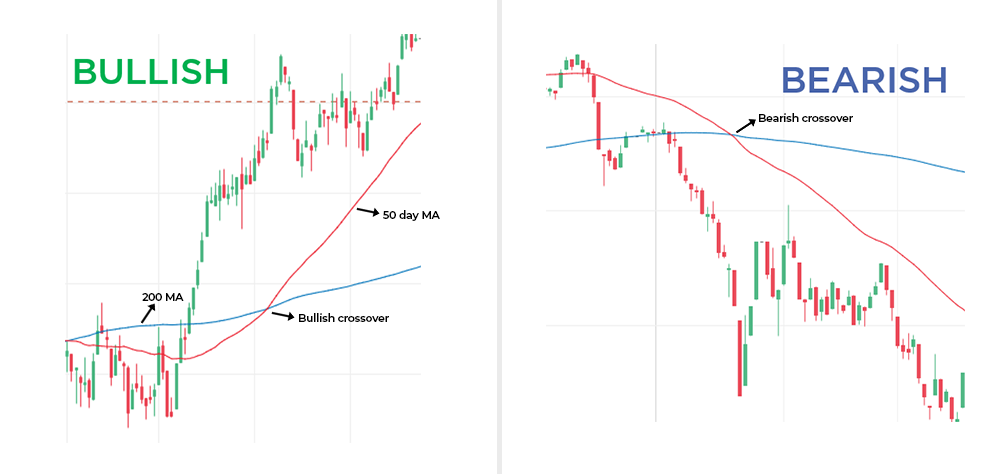
 3. Moving Average
This is one of the most commonly used indicators for establishing the trend. When the shorter term moving average crosses over the longer term moving average it’s an indicator that the trend is following the short term moving average.
If the short term moves above the longer term it indicates a bullish move,or if it moves below the longer term it indicates bearish.
4. ADX
Shows how strong the trend is. It is a great additional filter that can show if the trend is present or absent. Anything below 20 indicates the trend is absent or weak. When trading a breakout this can be used to weed out false moves.
Identifying a Breakout
One of the trading strategies we’ve built into our LITT system (Leading Indicator Trend Trading) is designed to identify breakout trades – we use exchange traded options (ETOs) for this particular system.
The system is looking for significant movements and works on the basis that if a key support or resistance level breaks, with the right conditions, we would expect to see a significant move in the underlying asset.
For a Bullish trade, if it is a resistance level that breaks, we would then use an ETO strategy called an ‘At the Money Bull Put spread’ because if the trade fails we are able to switch the strategy to trade the fake out.
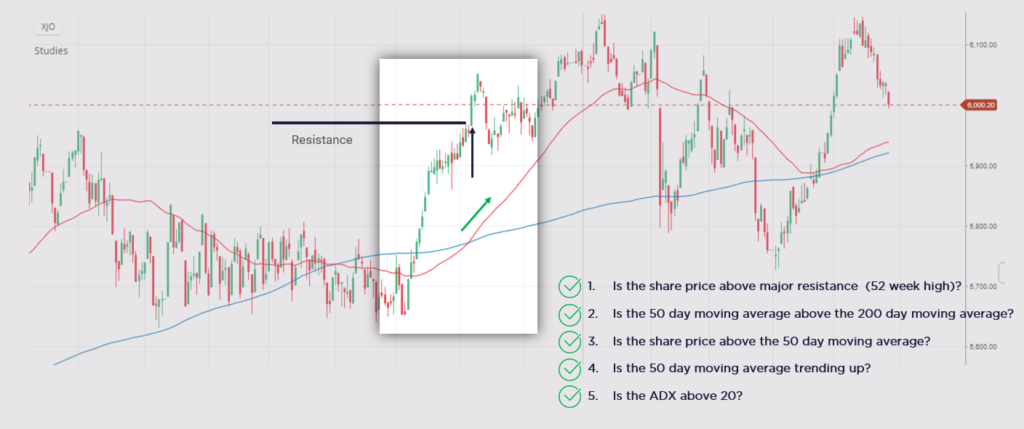
The Rules for Bullish Breakout
- Is the share price above major resistance (52 week high)?
- Is the 50 day moving average above the 200 day moving average?
- Is the share price above the 50 day moving average?
- Is the 50 day moving average trending up?
- Is the ADX above 20?
These are the indicators we look at when assessing one style of break out trading.
We have a separate checklist that we look at once we have entered a trade that tell us to close or switch the position.
Rules that will help you gain an edge using technical analysis;
- Have simple and clear rules that tell you exactly when to get in and when you should switch or close,
- Back test your rules – for this LITT system we backtested each optionable stock over thousands of scenarios**,
- Take the emotion out of it. If you have clear rules and confidence in them once your in the trade let the rules do the work.
** backtesting was only completed on ASX optionable stocks
*Please note: Past returns do not reflect future returns
General Advice Warning
Any advice provided by Reach Markets including on its website and by its representatives is general advice only and does not consider your objectives, financial situation or needs, and you should consider whether it's appropriate for you. This might mean that you need to seek personal advice from a representative authorised to provide personal advice. If you are thinking about acquiring a financial product, you should consider our Financial Services Guide (FSG) including the Privacy Statement and any relevant Product Disclosure Statement or Prospectus (if one is available) to understand the features, risks and returns associated with the investment.
Please click here to read our full warning.


