Lendlease Group (LLC) – Buy
Lendlease Group (LLC) FY18 results, came in above market expectations but management noted FY19 construction margins would likely be impacted by underperforming projects and elevated bid costs in Australia after narrowing in FY18.
COMPANY DATA
| Date of Report | ASX | Price | Price Target | Analyst Recommendation |
| 23/08/18 | LLC | A$20.08 | $21.47 | BUY |
| Date of Report 23/08/18 | ASX LLC |
| Price A$20.08 | Price Target $21.47 |
| Analyst Recommendation BUY | |
| Sector : Real Estate | 52-Week Range: A$15.11 – 21.73 |
| Industry: Diversified Real Estate Activities | Market Cap: A$11,623.6m |
Source: Bloomberg
INVESTMENT SUMMARY
We rate LLC as a Buy for the following reasons:
- Earnings visibility from strong pipeline across core segments (~$56.7bn in development pipeline; $22.4bn in construction backlog; $28.bn in FUM).
- Solid balance sheet with low gearing and available facilities to fund its development pipeline and construction backlog.
- Robust development outlook with demand for both commercial and residential especially with strong level of apartment pre-sales. For its development segment, we expect LLC to be able to deliver a ROIC of between 9% and 12% (currently significantly above at 18.8%).
- Robust outlook for LLC’s construction business with ~$20bn of new infrastructure projects to be tendered in Australia in the next 2 years, especially with ~$7bn of projects in Australia up for tender. For its construction segment, we expect LLC to be able to deliver a EBITDA margin of between 3% and 4% globally (currently below at 2.7%) and 4% to 5% in Australia.
- Expectations of solid net inflows for LLC’s investment management as investors seek higher yield in a lower interest rate environment. For its investment segment, we expect LLC to be able to deliver a ROIC of between 8% and 11% (currently above at 16.5%).
We see the following key risks to our investment thesis:
- Sudden increases in interest rates.
- Increase in apartments default rate.
- Any delays or execution problems in development and construction that sees margin being affected.
- Any net outflows from its investment management business.
Figure 1: EBITDA % by Segment
(target range in parentheses)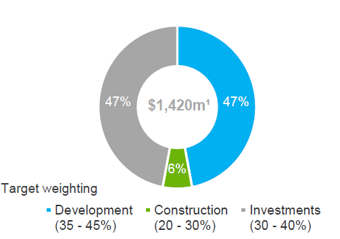
Source: Company
Source: Company
ANALYST’S NOTE
Lendlease Group (LLC) FY18 results, came in above market expectations but management noted FY19 construction margins would likely be impacted by underperforming projects and elevated bid costs in Australia after narrowing in FY18.
FY18 NPAT and EPS grew +5% to $792.8m and 136.1c respectively. ROE of 12.7% was at the mid-range of LLC’s 10-14% target range. We continue to like LLC for:
1. Its strong balance sheet (with low gearing ratio) to capitalize on its project pipeline/backlog;
2. Earnings visibilities on its increasingly sizeable order book.
LLC trades at a discount relative to ASX 200 peers, on a ~12.6x FY20 PE-multiple, with a ~6.0% dividend yield.
- FY18 Results – key highlights: LLC delivered strong results with:
1. FY18 profit after tax of $792.8m, up +5% on the prior year and EPS of 136.1c, was also up +5%, driven by strong performance of Developments & Investments segments more than offsetting underperformance of Construction segment.
2. Full year distributions of 69cps (equates to a 50% payout ratio).
3. Return on equity was 12.7%, towards the mid-range of LLC’s target range of 10-14%.
4. Commenced $500m of market buyback of which $178m (~35.6%) has been completed to date.
5. Gearing of 8.2% (increased 320bps over the pcp), interest cover of 10.7x and liquidity of $3bn, including cash and cash equivalents of $1.2bn and $1.8bn in undrawn debt facilities.
6. Development pipeline increased +44% to $71.1bn.
- Development (47% of operating EBITDA) – Development EBITDA increased by +21.9% to $673.2m. LLC has an extensive development pipeline of $71.1bn, with $55.9bn of urbanisation projects and $15.1bn of communities projects.
- Construction (6% of operating EBITDA) – Revenue from the segment was up +2% to $12.9bn but EBITDA declined -76.9% to 78.2m with EBITDA margin falling to 0.6% from 2.7%, primarily due to EBITDA loss of $23.1m in Australia following underperformance of engineering and services due to inclusion of reversal of previously booked margin and recognition of expected losses on underperforming projects. Construction backlog revenue stands at $21.1bn with an additional c.$12bn of preferred work at 30 June 2018.
- Investments (47% of operating EBITDA) – EBITDA increased +35% to $668.9m, primarily driven by uplift in co-ownership funds earnings by +41% to $536m due to strong leasing performance. EBITDA from Funds Under Management (FUM) was up +15% to $133m, driven by solid asset management performance across retail and US Military housing portfolio, with a +15% growth in FUM to $30.1bn, with an additional ~$4bn of secured future FUM. Co-investments revaluations were 12.8% of group operating EBITDA, up from 4% in FY17. In FY18 two new classes, residential and telecommunications infrastructure have been added to funds management platform which according to the management will be a growth driver for FUM income in FY19. Overall, according to management, the “Investments segment is in a solid position to deliver recurring earnings derived from the $3.4bn of investments, $30.1bn in FUM and ~$4bn of secured future FUM”.
- Balance sheet weaker than FY17. Gearing increased to 8.2% driven by +29.4% increase in net debt but was well below target range of 10-20% and interest coverage ratio rose to 10.7x, from 10.3x in FY17. Average debt maturity decreased to 4.6 years from 5.1 years in FY17. On a positive note, LLC had liquid assets of $3bn ($1.2bn in cash/cash equivalents, and the remainder in undrawn facilities). Development pipeline should drive earnings growth over time, however, in our view, rising interest rates may temper this somewhat. Construction backlog stands at $21.1bn.
- No specific guidance provided by management. CEO did noted, “The addition of four new projects in Europe brings our global portfolio of major urbanization projects to 18 and delivers on our stated objective of diversifying to targeted international gateway cities. We have future earnings visibility and expect our offshore projects to make a greater contribution over the medium term.”
FY18 RESULTS…
Figure 3: LLC FY18 results Summary
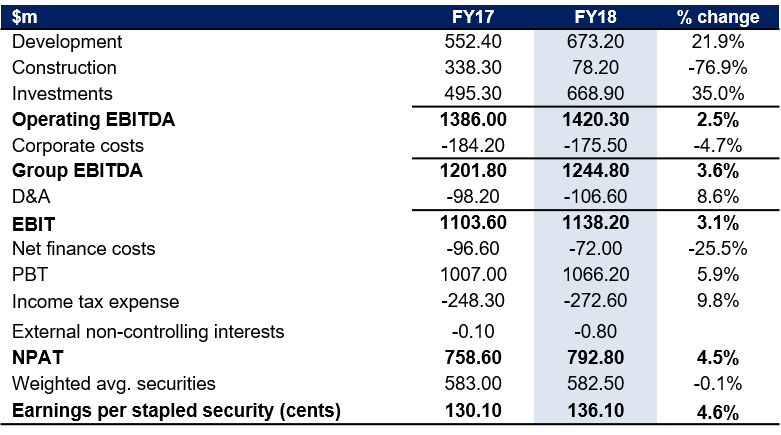
Figure 4: LLC Debt metrics
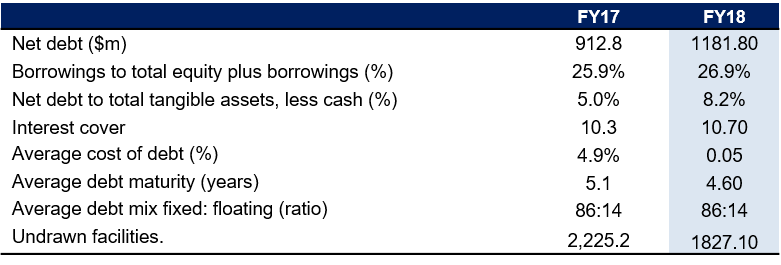
Figure 5: LLC Financial Summary
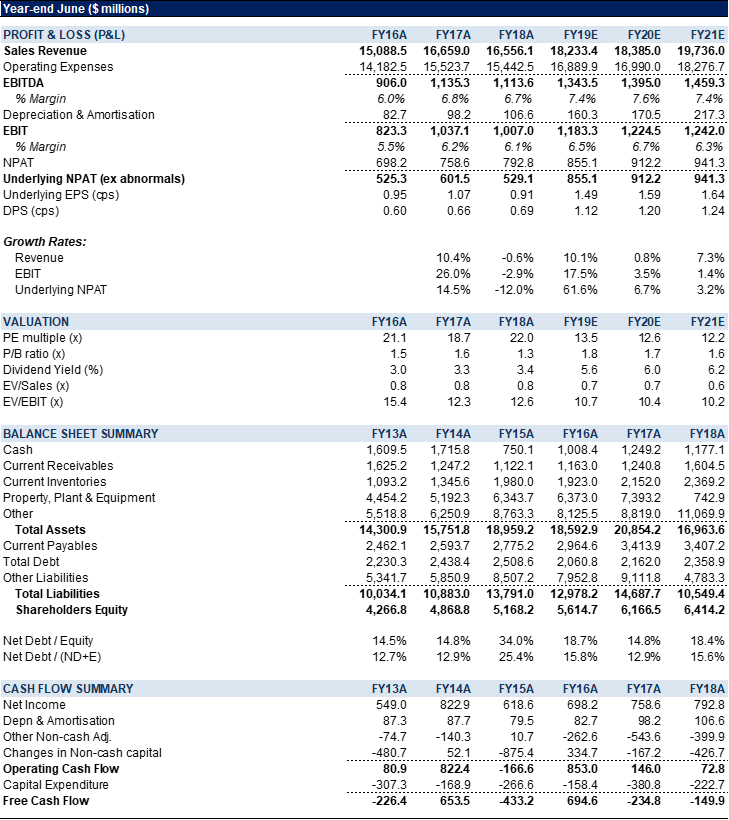
Source: Company, BTIG
COMPANY DESCRIPTION
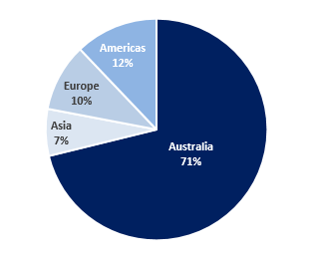
Lend Lease Corporation (LLC) is a global property developer with three key segments in (1) Development: involves development of communities, inner city mixed use developments, apartments, retirement, retail, commercial assets and social infrastructure (with earnings derived from development margins, development management fees received from external co-investors and origination fees for infrastructure PPPs) (2) Construction: involves project management, design, and construction service, predominately in infrastructure, defence, mixed use, commercial and residential sectors (with earnings derived from project and construction management fees and construction margin); and (3) Investments: involves wholesale investment management platform, LLC’s interests in property and infrastructure co-investments, Retirement and US military housing (with earnings derived from funds management fees as well as capital growth and yield from co-investments and returns from LLC’s retirement portfolio and US military housing business). LLC operates predominately in Australia, but also in the UK and US and with a smaller contribution to earnings derived from the Asia Pacific.
Recommendation Rating Guide
| Recommendation Rating Guide | Total Return Expectations on a 12-mth view |
| Speculative Buy | Greater than +30% |
| Buy | Greater than +10% |
| Neutral | Greater than 0% |
| Sell | Less than -10% |
Reach Markets Disclaimer
Reach Markets Pty Ltd (ABN 36 145 312 232) is a Corporate Authorised Representative of Reach Financial Group Pty Ltd (ABN 17 090 611 680) who holds Australian Financial Services Licence (AFSL) 333297. Please refer to our Financial Services Guide or you can request for a copy to be sent to you, by emailing [email protected].
Read our full disclaimer here >
