Northern Star Resources (NST) – Neutral
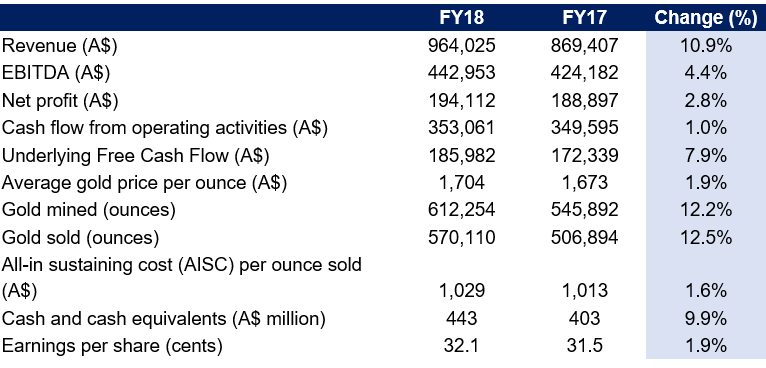
NST reported record FY18 results after a slightly disappointing half year, with key figures:
1. NPAT up +3% on the previous corresponding period (pcp) to $194.1m (excluding proceeds from asset sales in FY17);
2. Combined group EBITDA up +4% to $443m, and combined EBITDA at Jundee and Kalgoorie operations up +15% to $486m and a combined EBITDA margin of 53% on the back of the ramp up of production to 600,000ozpa;
3. Underlying free cash flow up +8% to $185m;
4. EPS up +2% from FY17 to 32.1cps; and
5. Final dividend up +11% to 5cps fully-franked (in line with management guidelines
COMPANY DATA
| Date of Report | ASX | Price | Price Target | Analyst Recommendation |
| 28/08/18 | NST | A$7.03 | A$7.00 | NEUTRAL |
| Date of Report 28/08/18 | ASX NST |
| Price A$7.03 | Price Target A$7.00 |
| Analyst Recommendation NEUTRAL | |
| Sector:Mining | 52-Week Range: A$4.75 – $7.65 |
| Industry: Precious Metal Mining | Market Cap: A$4,311.7m |
Source: Bloomberg
INVESTMENT SUMMARY
We rate NST as a Neutral for the following reasons:
- NST has a low cost base at A$1,032/oz or ~US$760/oz.
- Commodities price (in particular Gold) surprises on the upside especially due to geopolitical tensions.
- Leveraged to changes in the USD.
- Solid assets with deserve reserve/resource.
- Strong management team with significant mining expertise.
- Strong balance sheet with no debt and a policy to maintain A$300m in cash.
- Company has a good track record on shareholder return.
We see the following key risks to our investment thesis:
- Further deterioration in global macro-economic
- Deterioration in global gold supply & demand equation.
- Deterioration in gold prices.
- Production issues, delay or unscheduled mine shutdown.
- Adverse movements in AUD/USD
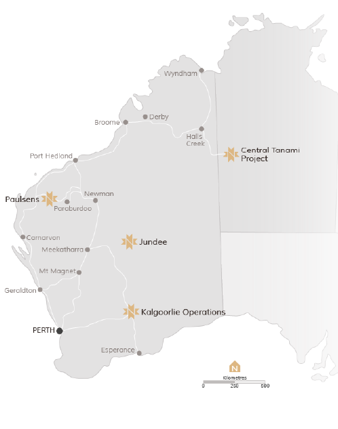
Figure 1: Locations of Operations 
Source: Company
ANALYST’S NOTE
NST reported record FY18 results after a slightly disappointing half year, with key figures:
1. NPAT up +3% on the previous corresponding period (pcp) to $194.1m (excluding proceeds from asset sales in FY17);
2. Combined group EBITDA up +4% to $443m, and combined EBITDA at Jundee and Kalgoorie operations up +15% to $486m and a combined EBITDA margin of 53% on the back of the ramp up of production to 600,000ozpa;
3. Underlying free cash flow up +8% to $185m;
4. EPS up +2% from FY17 to 32.1cps; and
5. Final dividend up +11% to 5cps fully-franked (in line with management guidelines)
Even more positive:
1. Resources increased to 15.9Moz (versus 2.5Moz in FY17), with measured and indicated resources increasing 55% to 9.8Moz.
2. Reserve capacity growing to 4Moz (versus 3.5Moz in FY17 and depletion of 0.6Moz from mining depletion) and
3. Both mines with established life visibility exceeding 10 years.
Furthermore, NST maintains low-cost base and a strong balance sheet with zero debt and funding capacity of $834m. For FY19, management guides production to between 600,000oz – 640,000oz at $1,025/oz – $1,125/oz, and has 259,018oz hedged at an average gold price of $1,752/oz.
We reiterate our neutral recommendation NST trades in line with our valuation.
- FY18 results – key highlights. Compared to the previous corresponding period (pcp),
1. Revenue was up +10.9% to 964m
2. EBITDA up +4.4% to A$443.0m and NPAT up 2.8% to A$194.1m.
3. Cash from operations was up +1% to $353.1m, with underlying free cash flow of $186.0m up +9% on pcp.
4. The Company declared a fully franked interim dividend of 5 cents per share, taking the full year payout to 9.5cps up from 9c in the pcp and in line with dividend policy of 6% of revenue.
5. NST sold 570,110oz (+12% on pcp) of gold at an average price of A$1,704/oz (+2% on pcp), while the all-in sustaining costs (AISC) were A$1,029/oz (+2% on pcp).
6. The Company has $433m cash & equivalents (up +10% on pcp) on the balance sheet with zero debt.
- Potential from ramp up in production, Reserve/Resource increases and extending mine life. A key highlight of the result was the update on exploration activities, which highlighted significant growth options for the Company to add to its existing mine life. While Kalgoorie earnings were previously the key drag on group performance during 1H18, a reversal is apparent after NST saw combined EBITDA (of Jundee and Kalgoorie operations) increase by +15% to $486m, with gold sold at both operations increasing by +21% and focus on production ramp up of these two key mines hitting 600,000oz/annum production targets, two months ahead of schedule. Management notes further reserve growth potential in FY19 after a +55% increase in Measured and Indicated Resources to 9.8Moz, reserve capacity increase to 4Moz (versus 3.5Moz in FY17 and depletion of 0.6Moz from mining depletion), and both mines with established life visibility exceeding 10 years.
- Strong balance sheet from no debt and sizeable cash balance to provide funding capacity and sustain dividend payout. NST has zero debt on their balance sheet and has increased their cash & equivalent balance by +65m to $512m. NST has committed $194m in exploration and assets (whilst also returning $63m in dividends to shareholders). Management noted current available funding capacity has increased to $834m. This level of funding capacity provides NST with significant capacity to fund organic and inorganic growth opportunities through the commodity cycle. Further, management maintained their dividend plan of 6% of revenue, premised on the high visibility over its near-term outlook and lower volatility at revenue level vs. net profit.
NST FY18 RESULTS SUMMARY
Figure 2: NST FY18 key headline numbers

Source: Company
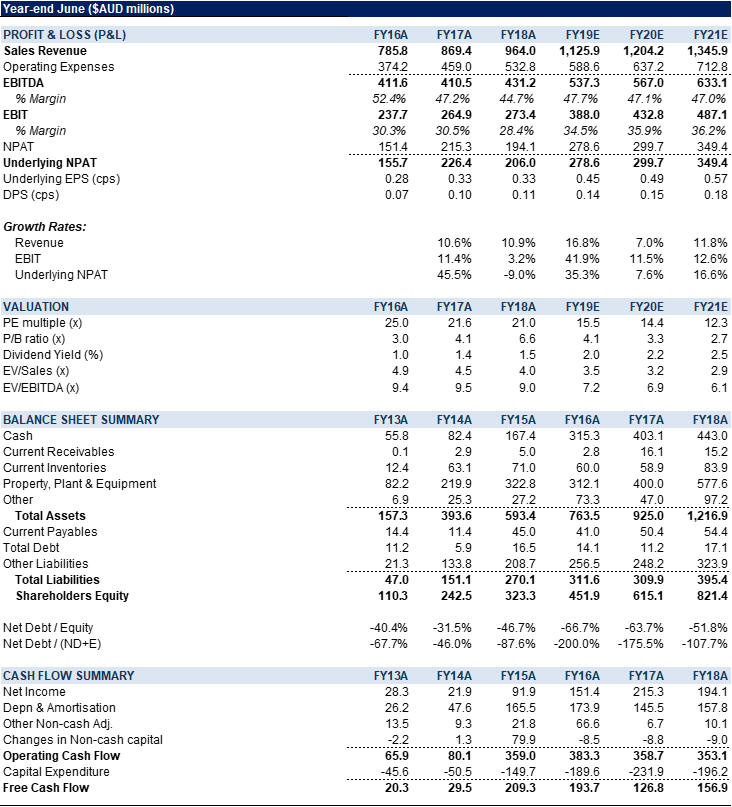
Figure 3: NST Financial Summary 
Source: Company, BTIG, Bloomberg
COMPANY DESCRIPTION
Northern Star Resources Limited (NST) is a gold production and exploration company with a Mineral Resource base of 10.2 million ounces and Ore Reserves of 3.5 million ounces, located in highly prospective regions of Western Australia and the Northern Territory. NST is the third largest gold producer in Australia.
Recommendation Rating Guide
| Recommendation Rating Guide | Total Return Expectations on a 12-mth view |
| Speculative Buy | Greater than +30% |
| Buy | Greater than +10% |
| Neutral | Greater than 0% |
| Sell | Less than -10% |
Reach Markets Disclaimer
Reach Markets Pty Ltd (ABN 36 145 312 232) is a Corporate Authorised Representative of Reach Financial Group Pty Ltd (ABN 17 090 611 680) who holds Australian Financial Services Licence (AFSL) 333297. Please refer to our Financial Services Guide or you can request for a copy to be sent to you, by emailing [email protected].
Read our full disclaimer here >
