Perpetual Ltd (PPT) – BUY
COMPANY DATA
| Date of Report | ASX | Price | Price Target | Analyst Recommendation |
| 31/08/18 | PPT | A$44.43 | A$46.89 | BUY |
| Date of Report 31/08/18 | ASX PPT |
| Price A$44.43 | Price Target A$46.89 |
| Analyst Recommendation BUY | |
| Sector : Financials | 52-Week Range: A$38.04 – 56.85 |
| Industry: Asset Management & Custody Banks | Market Cap: A$2,144.8m |
Source: Bloomberg
INVESTMENT SUMMARY
We rate PPT as a Buy for the following reasons:
- PPT trades below our DCF valuation and attractive mulitples relative to its peer-group.
- Post-acquisition of Trust Company, PPT is a diversified business with earnings derived from trustee services, financial advice and funds management.
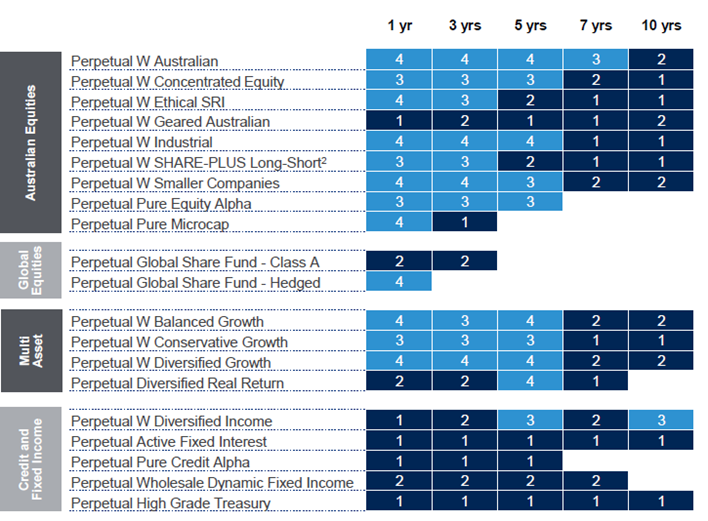
- PPT has an opportunity to increase FUM via its Global Share Fund, which has a strong performance track record over 1, 3 and 5-years and significant capacity, whilst PPT continues to maintain FUM in Australia equities which is near maximum capacity. This equates to flattish earnings growth unless PPT can attract FUM into international equities, credit and multl-asset strategies (and other incubated funds).
- Retail and institutional inflow of funds is expected to be solid especially from positive compulsory superannuation trend and flow from Perpetual Private.
- Potential for Perpetual Private to drive growth in funds under management and funds under advice.
- Cost improvements in Perpetual Private and Corporate Trust.
We see the following key risks to our investment thesis:
- Any significant underperformance across funds.
- Significant key man risk around key management or investment management personnel.
- Potential change in regulation (superannuation) with more focus on retirement income (annuities) than wealth creation.
- Average base management fee (bps) per annum (excluding performance fee) continues to be stable at ~70bps but there are risks to the downside from pressures on fees.
- More regulation and compliance costs associated with the provision of financial advice and Perpetual Private.
- Exposure to industry funds which are building in-house capabilities (~15-20% of total PPT funds under management).
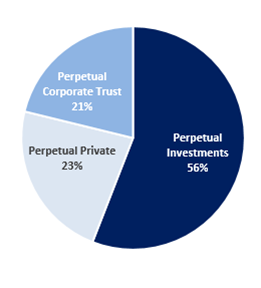
Figure 1: Profit Before Tax Split by Segments
Source: Company
ANALYST’S NOTE
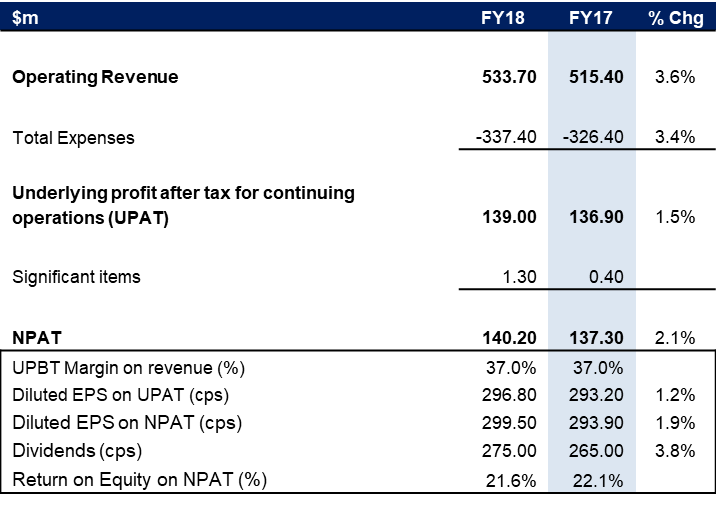
Perpetual Ltd (PPT) delivered solid results in FY18, with NPAT of $140.2m (up +2%) which was in line with consensus estimates, lifting the stock price marginally by +3.6%.
Growth in Perpetual Private was underpinned by 5% growth in FUA and growth in Perpetual Corporate Trust was driven by growth in securitization markets in Australia and continued market activity within commercial property and managed investment funds, together with higher asset prices.
Management has declared a final fully franked dividend of 140cps, taking the total dividend payout for FY18 to 275cps (up +4%) representing a payout ratio of 91%.
Whilst we are concerned about changes to strategy and personnel as Rob Adams, the new CEO joins from 24 September, we believe that PPT trades on attractive valuations and trading multiples (~14.7x PE20, 6.2% yield) – upgrade to Buy
- FY18 results summary. Key points include:
1. PPT reported revenue of 533.7m, up +3.6% over the pcp, driven by higher levels of FUM and FUA.
2. Expense growth was +3% on pcp, due to higher remuneration charges and an increase in depreciation & amortisation expenses from investments made in prior year.
3. NPAT was $140.2m, representing growth of +2.1%.
4. Board declared a final fully franked dividend of 140cps, taking the total dividend payout for FY18 to 275cps (up +4%) representing a payout ratio of 91%, which is within the Board’s stated dividend policy range of 80% to 100%.
5. Gearing ratio declined to 11.6% from 12.1% in FY17 and remained well within PPT’s limit of 30%.
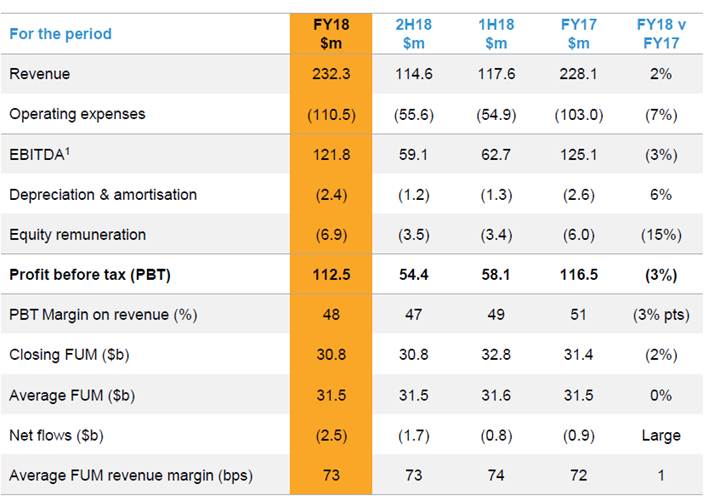
6. Net cash from operations declined by $14.1m and cash used in investing activities increased by $29.7m (due to decrease in net proceeds from sale of investments). - Perpetual Investments. The segment reported FY18 revenue of $232.3m (up +2%) and profit before tax of $112.5m, which was -3% lower compared to pcp, primarily driven by an increase in operating expenses partially offset by higher performance fees earned. Average FUM remained unchanged at $31.5bn with the benefit due to higher All Ords (up +6% on pcp) offset by prior period distributions and net outflows largely from Institutional clients and cost to income ratio increased to 52% from 49% in FY17. Average FUM revenue margins increased 1bps to 73bps but excluding performance fees earned, underlying average margins remained constant at 70bps. Total expenses were up +7% to $119.7m driven by new staff additions, increased variable remuneration expenses and higher equity performance fee expenses.
- Perpetual Private. FY18 revenue increased +5% to $186.4m and profit before tax was up +14% to $46.1m, driven by growth in market related revenue (FUA increased +5% to $14.1bn) due to higher equity markets, continued positive net flows and greater non-market related revenues, partially offset by an increase in staff and variable remuneration expenses (total expenses were up +2% to $140.3m). Perpetual Private experienced continued new client growth within the high net worth segment with the cost to income ratio declining to 75% from 77% in FY17.
- Perpetual Corporate Trust. FY18 total revenue of $103.3m, was up +11% and profit before tax of $42.6m (an increase of +16% compared to pcp), primarily driven by sustained growth in securitisation markets in Australia and continued market activity within commercial property and managed investment funds, together with higher asset prices, partially offset by continued investment in strategic initiatives. Cost to income ratio declined -1% to 59%, despite total expenses increasing by +8% to $60.7m due to continued investment in strategic initiatives. In FY18, Debt Markets Services revenue increased +11% to $57.5m and Managed Fund Services revenue was +13% higher at $45.8m.
PPT FY18 RESULTS SUMMARY
Figure 2: PPT FY18 results summary
Source: Company
Figure 3: Perpetual Investments
Source: Company
Figure 4: PPT Fund Rankings as per Mercer Wholesale and Institutional Surveys
Source: Company
Figure 5: Perpetual Private
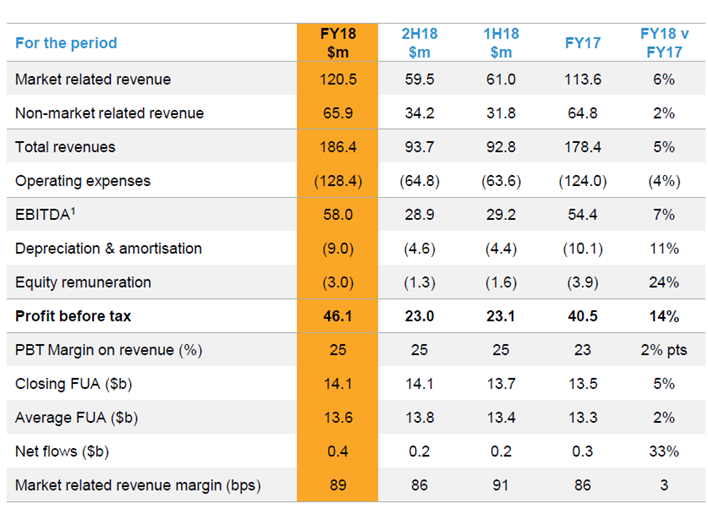
Source: Company
Figure 6: Perpetual Corporate Trust
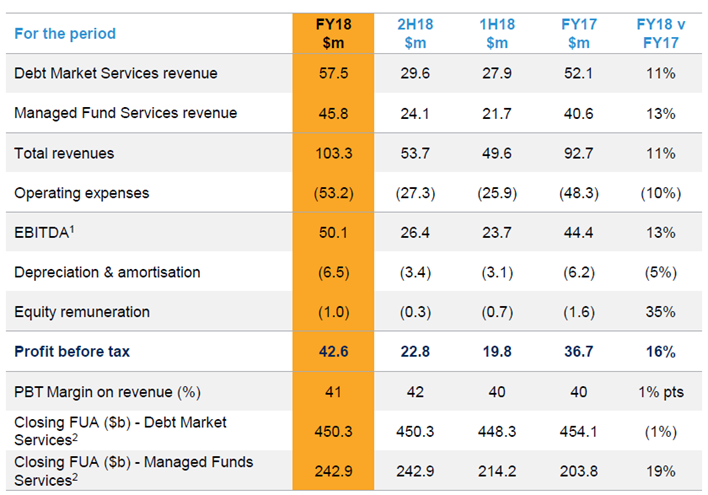
Source: Company
Figure 7: PPT Financial Summary
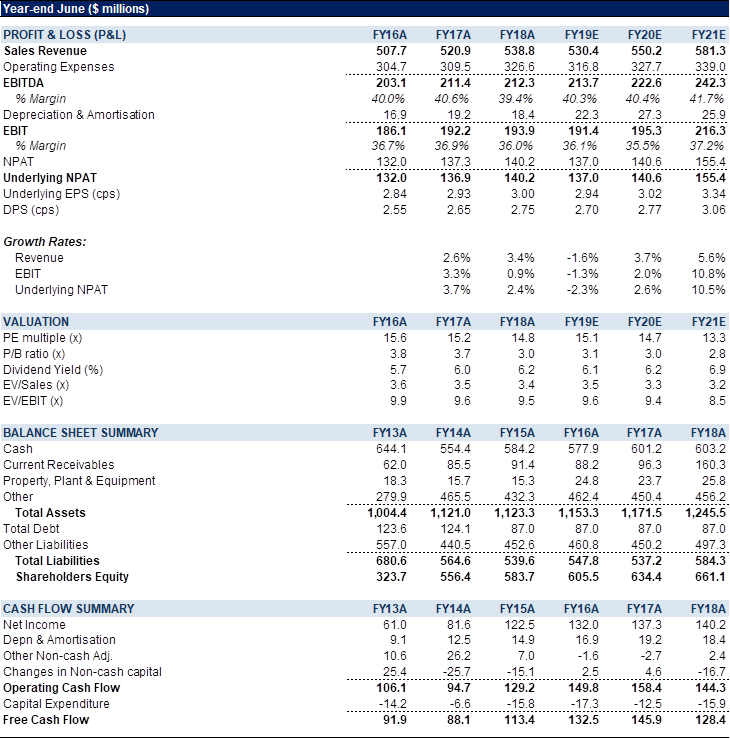
Source: BTIG estimates, Company, Bloomberg
COMPANY DESCRIPTION
Perpetual Ltd (PPT) is an ASX-listed independent wealth manager with three core segments in (1) Perpetual Investments which is one of Australia’s largest investment managers; (2) Perpetual Private which is one of Australia’s premier high net worth advice business; and (3) Perpetual Corporate Trust which provides trustee services. PPT manages ~$32.8 billion in funds under management, ~$13.7 billion in funds under advice and ~$662 billion in funds under administration (as at 30 June 2017).
Recommendation Rating Guide
| Recommendation Rating Guide | Total Return Expectations on a 12-mth view |
| Speculative Buy | Greater than +30% |
| Buy | Greater than +10% |
| Neutral | Greater than 0% |
| Sell | Less than -10% |
Reach Markets Disclaimer
Reach Markets Pty Ltd (ABN 36 145 312 232) is a Corporate Authorised Representative of Reach Financial Group Pty Ltd (ABN 17 090 611 680) who holds Australian Financial Services Licence (AFSL) 333297. Please refer to our Financial Services Guide or you can request for a copy to be sent to you, by emailing [email protected].
Read our full disclaimer here >
