Qantas Group Ltd (QAN) – BUY
| Date of Report | ASX | Price | Price Target | Analyst Recommendation |
| 28/08/18 | QAN | A$6.39 | A$7.55 | BUY |
| Date of Report 28/08/18 | ASX QAN |
| Price A$6.39 | Price Target A$7.55 |
| Analyst Recommendation BUY | |
| Sector : Materials | 52-Week Range: A$4.77 – 6.92 |
| Industry: Packaging & Containers | Market Cap: A$10,758.0m |
Source: Bloomberg
INVESTMENT SUMMARY
We rate QAN as a Buy for the following reasons:
- All segments delivering return on invested capital > weighted average cost of capital.
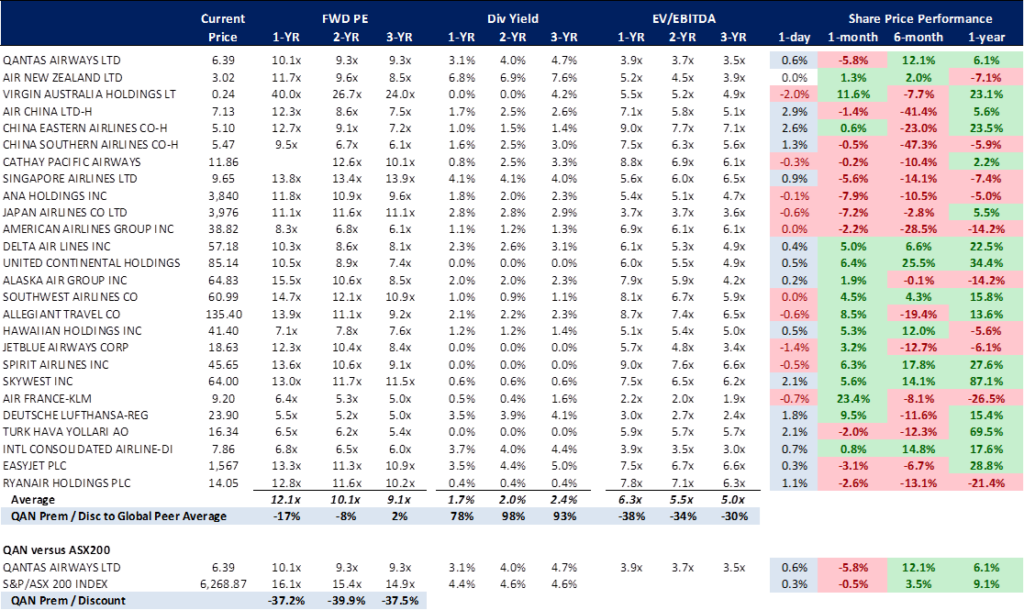
- QAN is trading at a discount to peer group average and broader Australian market.
- Strong position in domestic market (Qantas Domestic and Jetstar continue to remain the two highest margin earning airlines in the domestic market).
- Jetstar is well positioned for growth and rising demand in Asia.
- Partnership with Woolworths for Loyalty bodes well for membership and earnings.
- Oil prices expected to be fairly stable.
- Increased competition in international is affecting that segment.
- Relative to peers, strong balance sheet strength; investment grade credit rating.
We see the following key risks to our investment thesis:
- Disasters that could hurt the QAN brand.
- Ongoing price led competition forcing QAN to cut prices affecting margins.
- Leveraged to the price of oil.
- Adverse currency movements results in less travel.
- Labour strikes.
- Depressed economic conditions leading to less discretionary income to spend on travel.
ANALYST’S NOTE
Qantas Group (QAN) posted record profit levels with growth in all segments contributing to underlying profit of $1.6bn (up +14% on pcp).
Nonetheless, the stock was weaker on the day of earnings release after missing all but revenue consensus estimates as investors raised concerns over rising fuel prices and costs pressures.
For FY18, underlying EPS was up +18% to 64cps, unit revenue up +3.9% and net free cash flow up +$133m to $1.44bn. QAN’s net debt position of $4.9bn remains comfortably at the bottom of management’s target range.
Further, QAN declared a fully franked final dividend of 10cps as well as on market buy-back of up to $332m (totaling $500m in return to shareholders).
Whilst we note that FY19 fuel costs have been forecasted to rise (increase to ~$3.92bn vs. $3.23bn in FY18), management reaffirmed that they are confident that the Group will “substantially recover higher fuel costs in FY19” via hedging programs, introduction of newer fuel efficient models and changes to schedules to optimize revenue.
For FY19, QAN expects to “still deliver strong net free cash flow”. Maintain Buy – the stock is trading on a PE-multiple of 11x and EV / EBITDA multiple of 3.9x, both at a discount to global peer group average. Further, QAN also trades at a significant discount to the broader market as well (ASX200).
- FY18 key headline figures.
1. Return on Invested Capital at 22%;
2. Net free cash flow up +10% to $1.44bn;
3. Underlying EPS up +18% to 64c;
4. Total unit cost increase of +2.4% – excluding fuel;
5. Unit revenue up +3.9%;
6. Operating margin up +0.6pts to 10.5%;
7. operating cash flow up +$709m to $3.41bn;
8. Net free cash flow up +$133m to $1.44bn; and
9. net debt was at $4.9bn (below the bottom end of the target range).
- Higher fuel costs potentially squeezing margins. Higher fuels costs will impact QAN’s margins in FY19. Management called out that fuel costs will rise another $690m in FY19 (on the back of the $200m increase in FY18). However, given the strength of forward bookings, hedging strategies (costs 87% hedged in 1H19), ongoing efficiency measures (which has driven a -1% reduction in fuel consumption and is expected to continue in FY19), management is confident that such costs will be substantially recovered. Further, we would point out that higher fuel costs is an industry wide issue and whilst there is the threat that global players may become price competitive to ensure capacity is filled, we believe irrational pricing is likely to be avoided. Additionally, QAN derives a large part of its group earnings from domestic market, where competition and capacity remains rational.
- Domestic enjoying rational market dynamics. Domestic (Qantas Domestic & Jetstar Domestic) reported EBIT of $1.1bn, up +25% on pcp. The Company reported Domestic Unit Revenue growth of +6.8% over the year, whilst market capacity growth remain depressed (FY18 +0.1%; FY17 -0.5%; FY16 +0.6%).
- Capital Management. Current net debt at $4.9bn (comfortably in the lower-end of management’s target range of $5.0 – 6.2bn) continues to provide QAN with significant financial flexibility. This is furthered by the recent extended tenor (to 8 years) and diversified funding, and strong short term liquidity, with cash of $1.7bn and undrawn facilities of $1bn.
QAN'S FY18 RESULTS SUMMARY
Figure 1: FY18 QAN operating segments’ performance

Source: Company
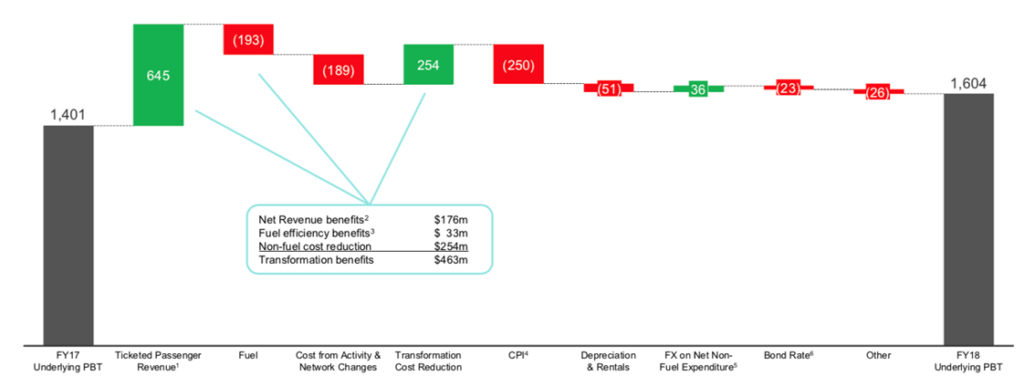
Figure 2: Profit Bridge – Underlying Profit Before Tax

Source: Company
FY18 key headline figures.
1. Return on Invested Capital at 22%;
2. Net free cash flow up +10% to $1.44bn;
3. Underlying EPS up +18% to 64c;
4. Total unit cost increase of +2.4% – excluding fuel;
5. Unit revenue up +3.9%;
6. Operating margin up +0.6pts to 10.5%;
7. Operating cash flow up +$709m to $3.41bn;
8. Net free cash flow up +$133m to $1.44bn; and
9. Net debt was at $4.9bn (below the bottom end of the target range).
QAN operating segments.
1. Domestic (Qantas Domestic & Jetstar Domestic) reported EBIT of $1.1bn, which was +25% higher on pcp. Margin growth was supported by efficiency gains and investment for higher premium services. Supported by healthy demand in all parts of the domestic markets, QAN’s corporate share remains robust, with SME share growing and leisure travel expanding.
2. International delivered a +7% increase in earnings to $399m and maintained margins despite strong competition and higher fuel prices. This was supported by a greater Load factor (how full flights are), which rose to 84% and a +4% increase in capacity. FY18 structural changes in Qantas international, such as the introduction of the 787 on new routes have started to deliver cost and revenue benefits, which will likely continue through FY19 and onwards. Qantas Freight continues to perform strongly with a strengthening international market and stable domestic market. JetStar International also posted strong profit from the expansion into key growth markets and consequent start-up of new routes.
3. Loyalty reported profits of $372m (up +1% from the prior year). However, margins eased due to mixed market conditions and promotions, but remained strong at 24.1%. The revenue growth is supported by new ventures into health insurance and financial services and growing Frequent Flyer program (+4.2% to reach 12.3m members).
Higher fuel costs potentially squeezing margins. Higher fuels costs will impact QAN’s margins however this is an industry wide issue. Management believes that fuel costs will rise another $690m in FY19 (on the back of the $200m increase in FY18). However, given the strength of forward bookings, hedging strategies (costs 87% hedged in 1H19), ongoing efficiency measures (which has driven a -1% reduction in fuel consumption and is expected to continue in FY19), management is confident that such costs will be substantially recovered.
Capital Management. Current net debt at $4.9bn (comfortably in the lower-end of management’s target range of $5.0 – 6.2bn) continues to provide QAN with significant financial flexibility. This is furthered by the recent extended tenor (to 8 years) and diversified funding, and strong short term liquidity, with cash of $1.7bn and undrawn facilities of $1bn.
FY19 Outlook…Management’s expectations for FY19 are:
1. Fuel bill to increase to ~3.92bn (up $690m) – management however is confident that the Group will “substantially recover higher fuel costs in FY19”;
2. Inflation impact on Group expenditure (including wage growth) to be ~$250m;
3. Net Capex to be $1.0bn – on track to complete a combined $3bn for FY18/19;
4. Transformation benefits to be ~$400m;
5. Total group capacity to increase by ~0-1% in 1H19, with Group International up by +1% and Group Domestic capacity flattish;
6. Net depreciation and non-cancellable aircraft operating leases to be ~$155m higher than FY18.
QAN’s peer group analysis…
QAN’s relative valuation, both to global peers and the ASX200, remains undemanding to attractive. This is despite the potential for ongoing capital management initiatives. Further, QAN offers an attractive fully franked dividend yield of approximately 4%.
Figure 3: QAN comparable table

Source: Bloomberg
Figure 4: QAN Financial Summary

Source: BTIG, Company, Bloomberg
COMPANY DESCRIPTION
Qantas Airways Ltd (QAN) provides passenger and freight air transportation services in Australia and internationally. QAN also operates frequent flyer loyalty program. QAN was founded in 1920 and is headquartered in Mascot, Australia.
Source: Company
Recommendation Rating Guide
| Recommendation Rating Guide | Total Return Expectations on a 12-mth view |
| Speculative Buy | Greater than +30% |
| Buy | Greater than +10% |
| Neutral | Greater than 0% |
| Sell | Less than -10% |
Reach Markets Disclaimer
Reach Markets Pty Ltd (ABN 36 145 312 232) is a Corporate Authorised Representative of Reach Financial Group Pty Ltd (ABN 17 090 611 680) who holds Australian Financial Services Licence (AFSL) 333297. Please refer to our Financial Services Guide or you can request for a copy to be sent to you, by emailing [email protected].
Read our full disclaimer here >
