Telstra Corporation (TLS) – NEUTRAL
COMPANY DATA
| Date of Report | ASX | Price | Price Target | Analyst Recommendation |
| 20/08/18 | TLS | A$3.08 | A$3.00 | NEUTRAL |
| Date of Report 20/08/18 | ASX TLS |
| Price A$3.08 | Price Target A$3.00 |
| Analyst Recommendation NEUTRAL | |
| Sector: Telecommunication Services | 52-Week Range: A$2.6 – 3.90 |
| Industry: Integrated Telecommunication Services | Market Cap: A$36,631.4m |
Source: Bloomberg
INVESTMENT SUMMARY
We rate TLS as a Neutral for the following reasons:
- Additional cost measures announced to support earnings.
- InfraCo provides optionality in the long-term.
- Despite intense competition, subscriber growth numbers remain solid.
- Company looking to monetize $2.0bn of assets.
- In the long-term, the introduction of 5G provides potential growth.
- TLS still commands a strong market position and has the ability to invest in growth technologies and areas (e.g. Telstra Ventures) which could provide room for growth.
We see the following key risks to our investment thesis:
- Further cuts to dividends.
- Further deterioration in the core mobile and fixed business.
- Management fail to deliver of cost-out targets and asset monetisation.
- Any increase in churn, particularly in its Mobile segment – worse than expected decrease in average revenue per users (or any price war with competitors).
- Any network disruptions/outages.
- More competition in its Mobile segment.
- Quicker than expected deterioration in margins for its Fixed segment.
- Risk of cost blowout in upgrade network and infrastructure to 5G.
ANALYST’S NOTE
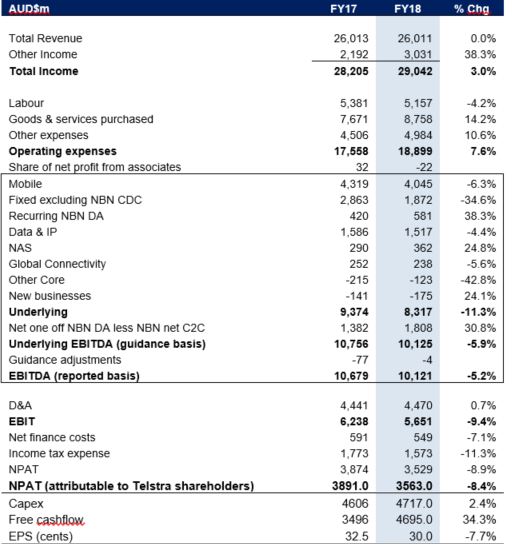
TLS reported its FY18 results, with EPS, NPAT and EBITA coming in above analyst estimates by +5.7%, +4.4% and +0.7%, respectively. However, this beat was driven by lower depreciation expense relative to expectation due to TLS extending the useful life of a fixed asset.
Total income for the year was up +3.0%, whilst EBITDA fell -5.2% and NPAT was down -8.9%. The key positive from the result was the strong growth in postpaid subscriber growth (+304k) in mobile, with a particularly strong second half of the year (as TLS increased its value proposition relative to competitors such as pricing and data inclusions).
However, ARPUs remain under pressure. No dividend guidance was provided and we believe maintaining 22cps DPS will be a struggle (consensus currently sits at 17cps for FY19E). Maintain Neutral given the many moving parts with TLS operationally and the stock looking fully valued on an ex-NBN payment basis.
- Key FY18 headline numbers.
1. On a reported basis, total income was up +3.0% to $29.0bn, EBITDA down -5.2% to $10.1bn, NPAT down -8.9% to $3.5bn and EPS reduced -7.7% to 30.0cps.
2. The FY18 final dividend was declared at 11cps (fully franked), bringing the total dividend for the year to 22cps which comprises of the ordinary divided of 15cps and a special dividend of 7cps in accordance with TLS’s revised dividend policy.
3. Free cash flow (FCF) of A$4.9bn was above pcp of $4.0bn due to improvement in working capital, partly offset by increased cash capex on strategic investments.
4. Underlying core fixed costs reduced by -7%.
5. Gross and net debt reduced by -4.9% and -3.9%, respectively, using free cash flow generated in FY18. - Declining ARPU and accelerated NBN rollout – drag on EBITDA.
1. Mobile revenue grew +0.4% on the prior corresponding period but mobile broadband revenue declined by -10.3%, dragging down mobile EBITDA by -6.3%. ARPU continues to decline due to increased competition, lower prices and increased data allowances.
2. Accelerated rollout of NBN is putting pressure on other segments, with $1.4bn of annual $3.0bn impact already absorbed, reflecting a decline of Fixed segment EBITDA. Fixed segment revenue declined by -9.2% to $5.8bn and EBITDA declined by -34.6%, with performance largely impacted by the increased rate of NBN migration and increasing pressures due to competition. - FY19 guidance unchanged. Management reaffirmed guidance with income expected to be between $26.5bn – $28.4bn and EBITDA (excluding restructuring costs) of $8.8 -$9.5bn.
- No dividend guidance. The Company did not provide any guidance on dividend, however in our view the Company will find it difficult to sustain 22cps per share given the pressure on earnings. We note consensus is forecasting TLS to pay a dividend of 17cps in FY19E.
- Cost outs on track. Management continues to progress on its cost-out strategy, with underlying costs down -7% year-on-year and management achieving $700m in savings (since FY16) against their target of $2.5bn.
FY18 Results Summary…
Figure 1: Key headline numbers for FY18

Source: Company
FY19 guidance unchanged. Management reaffirmed guidance figures which were provided at Telstra’s T22 announcement, adjusted for the impact of AASB15, which decreased income guidance by $100m and increased EBITDA guidance by $100m –
1. Income expected to be between $26.5bn – $28.4bn
2. EBITDA (excluding restructuring costs) of $8.8 -$9.5bn. FY19 additional restructuring costs are expected to be around $600 million.
3. Net one-off nbn DA receipts less nbn cost to connect of $1.8bn to $1.9bn
4. Capex between $3.9bn to $.4.4bn or approximately 16%-18% of sales
5. Free cashflow in the range on $3.1bn to $3.6bn.
6. DRP to be recommenced from the FY18 interim dividend.
7. Management noted that FY19 is a very material year in the migration to the NBN and its impact on Telstra.
8. TLS is on track to achieve more than $500m EBITDA benefits from strategic investment by end of FY21.
9. Management noted that challenging trading conditions are expected to continue in FY19, including pressure on ARPU and further negative impact of the NBN network rollout on TLS’s underlying earnings.
Valuation Summary…
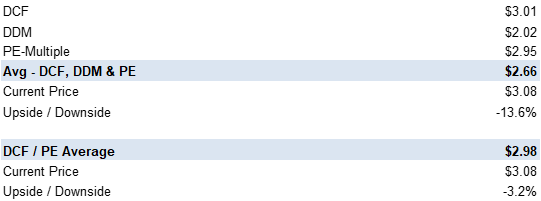
We use three main valuation methodologies to value TLS shares – DCF, Dividend Discount Model and PE-relative. In the figure below, we provide our three valuations, updated for our revised earnings and dividend payout ratio.
Figure 2: TLS valuation summary

Source: BTIG estimates
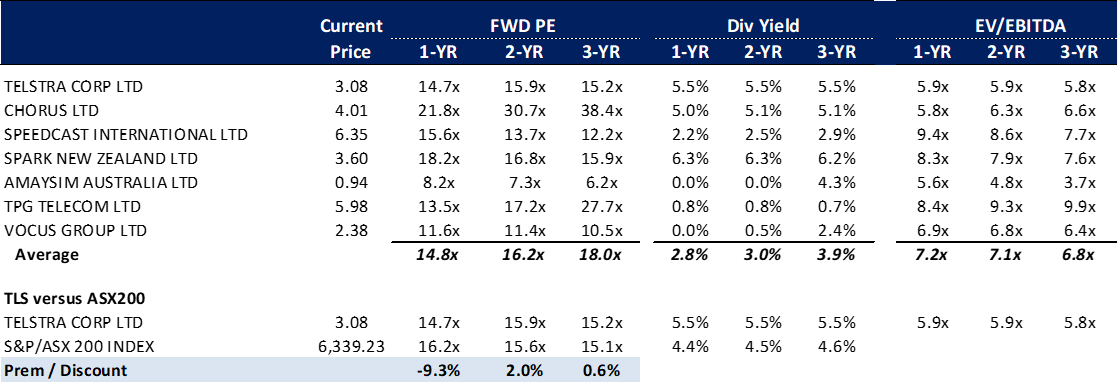
PE-relative valuation. For our PE-multiple valuation, we have used consensus peer group average PE-multiple and applied a 10% discount to this multiple. We believe this discount to the market should adequately account for the negative sentiments towards the potential downside to TLS’ dividend yield.
Figure 3: TLS valuation summary 
Source: Bloomberg
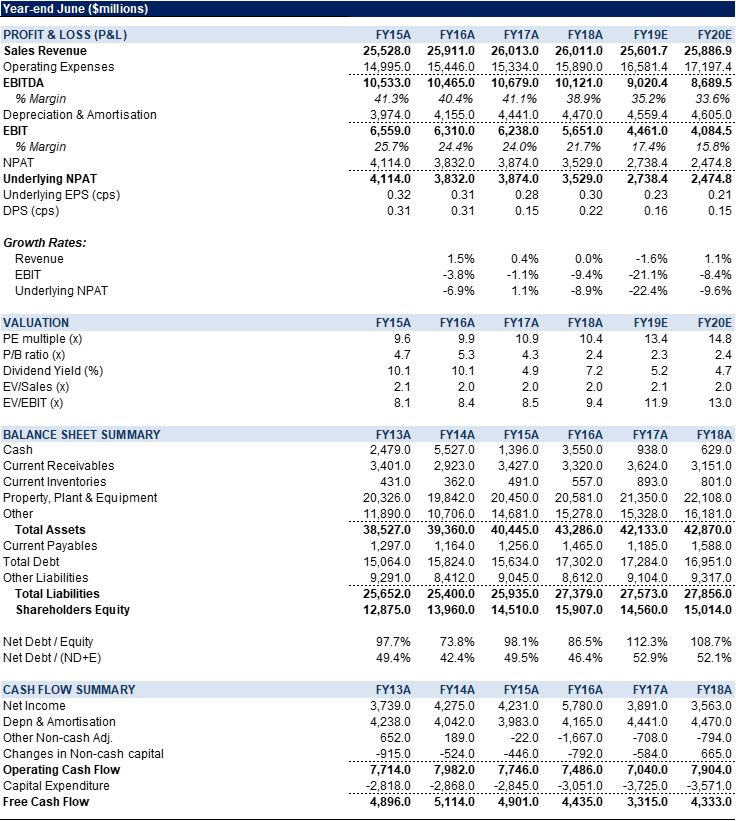
Figure 4: TLS Financial Summary 
Source: Company, BTIG, Bloomberg
COMPANY DESCRIPTION
Telstra Corporation (TLS) provides telecommunications and information products and services. The company’s key services are the provision of telephone lines, national local and long distance, and international telephone calls, mobile telecommunications, data, internet and on-line. Its key segments are Mobile, Fixed, Data & IP, Foxtel, Network applications and services and Media.
Recommendation Rating Guide
| Recommendation Rating Guide | Total Return Expectations on a 12-mth view |
| Speculative Buy | Greater than +30% |
| Buy | Greater than +10% |
| Neutral | Greater than 0% |
| Sell | Less than -10% |
Reach Markets Disclaimer
Reach Markets Pty Ltd (ABN 36 145 312 232) is a Corporate Authorised Representative of Reach Financial Group Pty Ltd (ABN 17 090 611 680) who holds Australian Financial Services Licence (AFSL) 333297. Please refer to our Financial Services Guide or you can request for a copy to be sent to you, by emailing [email protected].
Read our full disclaimer here >
